
Con el Big Data y los grandes volúmenes de datos disponibles, actualmente es necesario contar con herramientas de visualización de datos que permitan representar gráficamente, de manera simple y clara, aquella información valiosa para la toma de decisiones de las empresas.
El Big Data en ecommerce se ha convertido en un activo indispensable para las empresas que aprendan cómo utilizarlo. Para poder aprovechar los datos, no basta con recopilarlos. Sin una herramienta capaz de procesarlos y transformarlos en información útil y accionable, sencilla de visualizar, difícilmente podremos operar sobre ellos.
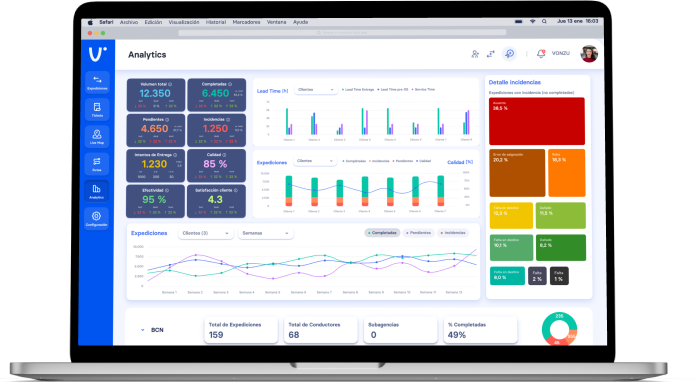
Con data visualization es posible enfocarse en los KPI´s más importantes, a través de dashboards atractivos para el receptor, que permiten acelerar el proceso de toma de decisiones, identificar tendencias y optimizar tiempos, entre otros beneficios.
¿Qué ventajas y beneficios tiene la visualización de datos?
Con el aumento exponencial del volumen de datos debido al acelerado crecimiento del comercio electrónico en el mundo, la visualización de datos resulta clave para las empresas que pretendan realizar un uso adecuado de esa información para detectar oportunidades y/o mejorar sus procesos.
Son múltiples las ventajas que supone contar con una adecuada herramienta de visual data. En este artículo, desarrollaremos los 4 beneficios más esenciales de la visualización de datos.
Fácil de entender
La principal ventaja de la visualización de datos es que permite comprender instantánea y sencillamente grandes volúmenes de datos representados a través de diversos formatos gráficos.
Está demostrado que el cerebro humano responde mejor a las señales visuales que al contenido escrito. Es más rápido y fácil para el cerebro procesar la información de manera visual, que a través de la lectura y comprensión de textos o números.
Con una herramienta de visualización de datos, los responsables de tomar decisiones clave en las empresas pueden acceder a información valiosa de un vistazo y en tiempo real.
La posibilidad de absorber información en tiempo real permite actuar de forma inmediata, anticipándose en la toma de decisiones para evitar posibles inconvenientes o para mejorar procesos que pueden traducirse en beneficios económicos para las empresas.
Gracias a la tecnología y la visualización de datos, actualmente las empresas pueden contar con una visión global y unificada de sus operaciones, monitorizando en todo momento qué está sucediendo en sus compañías.
Detección de patrones
Otro de los beneficios de contar con un software de visual data tiene que ver con la posibilidad de identificar patrones y tendencias para mejorar la experiencia y satisfacción de los clientes.
Poder visualizar datos relacionados con el comportamiento y hábitos de compra de los consumidores, permite detectar patrones que le permitirán a las empresas desarrollar estrategias de marketing para impulsar sus ventas, mejorar procesos de atención al cliente, optimizar su cadena logística, entre otras ventajas.
En un mercado tan competitivo y cada vez más exigente como el del comercio electrónico, esta posibilidad puede resultar crucial para ganar ventaja tomando decisiones basadas en datos concretos y reales que garanticen la sostenibilidad del negocio.
Ayuda en la toma de decisiones
Como venimos mencionando, en definitiva a lo que apunta la visualización de datos es a la posibilidad de tomar mejores decisiones, en el momento oportuno.
Con una adecuada visualización de datos es posible, no sólo acelerar sustancialmente el proceso de toma de decisiones, sino fundamentalmente acotar el margen de error sobre decisiones equivocadas tomadas a ciegas.
Con el volumen de datos sobre clientes y condiciones del mercado disponibles, y una buena herramienta de visualización de esos datos, los líderes empresariales que sepan cómo aprovecharla dispondrán de información clave para detectar oportunidades de negocio antes que sus competidores.
En síntesis, la visualización de datos facilita el análisis de información clave para poder actuar más rápida y eficientemente, ayudando a las empresas en la toma de decisiones estratégicas y operativas.
Ahorro de tiempo
La visualización de datos permite a las empresas ahorrar tiempo y recursos en la generación de informes complejos a través de tableros anticuados u hojas de excel que además corren el riesgo de representar mal los datos.
Mediante información accesible y visualmente fácil de entender, los colaboradores de los distintos departamentos de una empresa pueden enfocarse en el análisis de los indicadores clave para la toma de decisiones, ahorrando tiempos de procesamiento de datos y producción de informes.
Además, gracias a las pantallas de visualización de datos, los principales KPI´s de una empresa se actualizan en tiempo real y pueden consultarse en cualquier momento, desde múltiples dispositivos, teniendo los datos siempre a mano cuando se los necesite.
Conclusión
Con la visualización de datos, las empresas pueden analizar las principales métricas de su negocio de manera simple, clara y en tiempo real, impulsando una toma de decisiones ágil y eficiente.
A través de gráficos, mapas de calor y otros formatos visuales, actualmente es posible acceder a grandes volúmenes de datos transformados en información valiosa, que permiten tener una visión global y unificada del negocio.
Esta posibilidad no solo supone cuantiosos ahorros de tiempos en procesamiento de datos y generación de informes, sino que además permite identificar oportunidades y tendencias, ya sea para mejorar la rentabilidad del negocio o para mejorar algún proceso operativo y/o logístico.
Gracias a la visualización de datos y estadísticas en tiempo real, hoy es posible anticiparse en la toma de decisiones a través de herramientas que ofrecen distintas funcionalidades que facilitan la gestión de esos datos.